
Asymmetric, GAM-based smoothed-association matrices: a directional
y ~ s(x) / x ~ s(y) fit for every pair of
continuous variables, so shape and direction survive where a Pearson
correlation matrix collapses both away.


Asymmetric, GAM-based smoothed-association matrices for continuous
variables. Each off-diagonal cell [r, c] shows the
directional mgcv::gam() fit of the row variable on the
column variable, so the two cells of a pair tell different stories
whenever the relationship is asymmetric, which is where a scalar Pearson
correlation loses information.
Two novelties, paired with the asymmetry story:
A = |EDF_yx − EDF_xy| / (EDF_yx + EDF_xy) ∈ [0, 1] — a
single-number summary of the directional disparity per pair. It varies a
good deal from sample to sample, so janusplot_reference()
gives the size it reaches by chance for a pair.linear_up,
skewed_peak, bimodal, bi_wave,
rippled_monotone, …) via a (T, I) dispatch on
turning-point and inflection counts, with monotonicity/convexity indices
for disambiguation. The taxonomy rolls up through three broader tiers:
archetype (7), monotonic (3),
linear (2) — grounded in shape-constrained regression (Pya
& Wood 2015), dose-response pharmacology (Calabrese 2008), and Morse
critical- point classification (Milnor 1963).corrplot and XICOR give one number per pair, and a GGally plot matrix shows each pair’s data. janusplot fits a smooth in each direction for every pair, draws both fits in the matrix, and reports how much the two directions differ and what shape each curve takes.
# released version from CRAN
install.packages("janusplot")

# development version, with the vignettes built, from r-universe
install.packages("janusplot",
                 repos = c("https://max578.r-universe.dev",
                           "https://cloud.r-project.org"))
janusplot_direction() needs the suggested package kernR,
which is not on CRAN:
install.packages("kernR", repos = "https://max578.r-universe.dev").
Fit once, then draw. The examples use the Palmer penguins data from
the suggested package palmerpenguins
(install.packages("palmerpenguins")). Any data frame with
numeric columns works the same way, for example
janusplot_fit(mtcars[, c("mpg", "hp", "wt", "qsec")]).
library(janusplot)

vars <- c("bill_length_mm", "bill_depth_mm", "flipper_length_mm",
          "body_mass_g")
fit <- janusplot_fit(palmerpenguins::penguins, vars)
fit
#> janusplot fit: 4 variables (bill_length_mm, bill_depth_mm, flipper_length_mm, body_mass_g)
#> 6 pairs, 12 directed cells
#> engine = bam, method = fREML, adjust = none
#> no flags
#> Largest asymmetries:
#>   bill_length_mm <-> body_mass_g  A = 0.55  body_mass_g ~ bill_length_mm: EDF 3.4, p < 0.001, rippled_monotone | bill_length_mm ~ body_mass_g: EDF 1.0, p < 0.001, linear_up
#>   bill_length_mm <-> bill_depth_mm  A = 0.10  bill_depth_mm ~ bill_length_mm: EDF 6.8, p < 0.001, bimodal | bill_length_mm ~ bill_depth_mm: EDF 5.6, p < 0.001, bimodal
#>   flipper_length_mm <-> body_mass_g  A = 0.09  body_mass_g ~ flipper_length_mm: EDF 3.8, p < 0.001, s_shape | flipper_length_mm ~ body_mass_g: EDF 4.6, p < 0.001, s_shape
#>   bill_depth_mm <-> body_mass_g  A = 0.08  body_mass_g ~ bill_depth_mm: EDF 7.4, p < 0.001, warped_wave | bill_depth_mm ~ body_mass_g: EDF 6.3, p < 0.001, warped_wave
#>   bill_depth_mm <-> flipper_length_mm  A = 0.02  flipper_length_mm ~ bill_depth_mm: EDF 7.1, p < 0.001, warped_wave | bill_depth_mm ~ flipper_length_mm: EDF 7.4, p < 0.001, warped_wave
#> Use summary() for the per-cell table and plot() for the matrix.
plot(fit)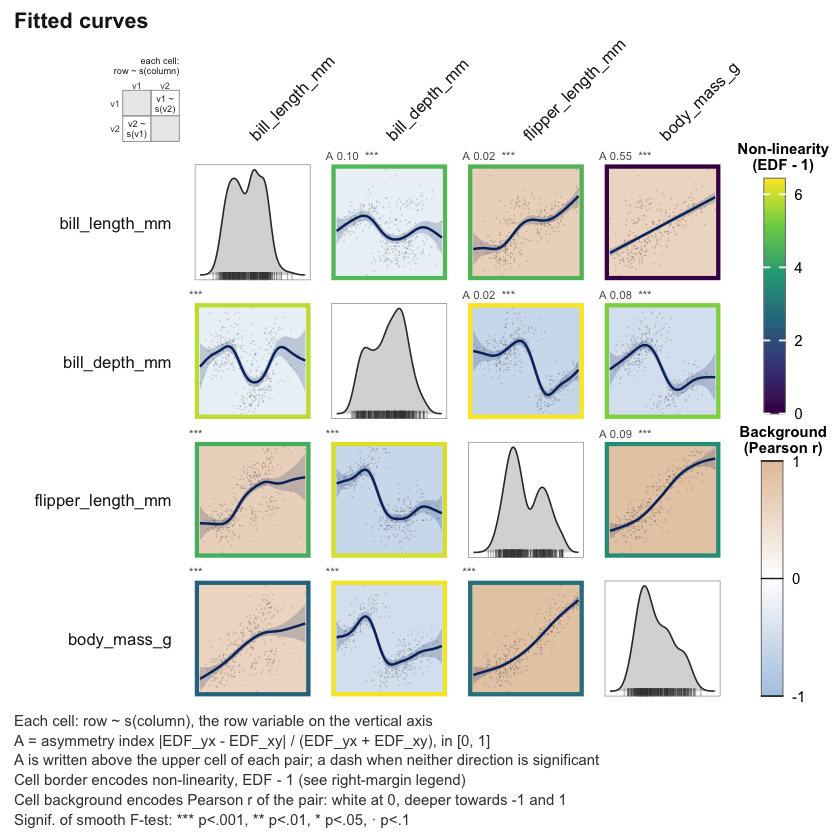
Each cell [r, c] shows row ~ s(column),
with the key in the top-left corner. By default:
colour_by = also takes "asymmetry",
"pearson", "spearman", "kendall",
"deviance_gap" or "none").background_by = takes "spearman",
"kendall" or "none"). A fit with
adjust draws no background, since its curves are adjusted
and the correlation is marginal.A of the pair, written once because it belongs to the pair.
From thirteen variables the strip carries the glyph alone, and
A is read from summary().janusplot_style(), passed as style =.Ask for the two-letter shape code and the legend of the 27 shape categories comes with it:
plot(fit, annotations = c("A", "code"))The two directions of one pair, side by side:
janusplot_pair(fit, x = "flipper_length_mm", y = "body_mass_g")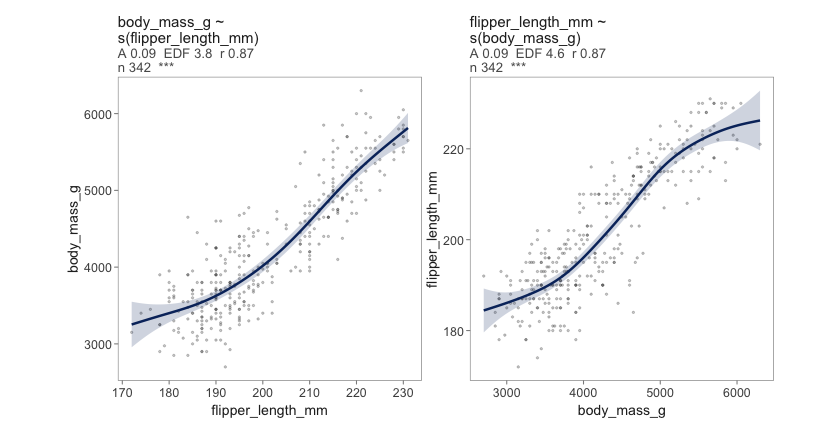
janusplot() fits and draws the matrix in one call:
janusplot(palmerpenguins::penguins, vars).
| Archetype (7) | Categories | Example |
|---|---|---|
monotone_linear |
linear_up linear_down |
y = x |
monotone_curved |
convex_up concave_up
convex_down concave_down s_shape
rippled_monotone |
tanh, sqrt, exp(−x) |
unimodal |
inverted_u skewed_peak
broad_peak rippled_peak and their reflections
u_shape skewed_trough
broad_trough rippled_trough |
(x−.5)², sin(πx²), plateau |
wave |
wave warped_wave rippled_wave
complex_wave |
sin(2πx) family |
multimodal |
bimodal bimodal_ripple
bi_wave bi_wave_ripple |
two-peak mix, sin(4πx) |
chaotic |
complex |
≥ 5 extrema / inflections |
degenerate |
flat indeterminate |
constant / fit failure |
Full table (with 2-letter codes + monotonic / linear rollups + glyph
+ gloss) via janusplot_shape_hierarchy().
The classifier’s recovery behaviour is characterised across a full factorial of sample sizes × noise levels × ground-truth shapes:
# Precomputed 2160-fit demo sweep
plot(shape_sensitivity_demo, "recovery_curves")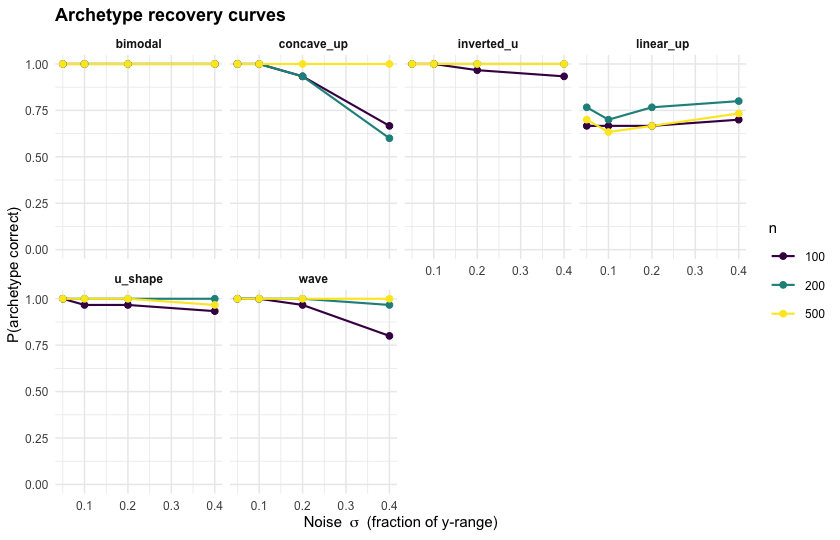
plot(shape_sensitivity_demo, "confusion_archetype")
summary(shape_sensitivity_demo, level = "archetype")

# Run your own: the full grid in parallel
future::plan(future::multisession, workers = 4L)
res <- janusplot_shape_sensitivity(parallel = TRUE)
plot(res, "accuracy_grid")
Four diagnostic plots ("confusion_fine",
"confusion_archetype", "accuracy_grid",
"recovery_curves") and summary() at the fine
and archetype levels. Design, pre-registered hypotheses, and full
walk-through in the shape-recognition-sensitivity
vignette.
Fit once, view many:
janusplot_fit() fits every ordered pair once;
print(), summary() (one row per directed cell)
and plot() (the matrix) read the same object without
refitting.
janusplot_pair(): the two
directions of one or more pairs side by side, or overlaid in one
standardised panel (display = "both").
janusplot_compare(): two fits of
the same variables matched cell by cell, typically marginal against
adjusted, with the cells whose shape changed marked:
fit_adj <- janusplot_fit(palmerpenguins::penguins, vars,
                         adjust = ~ species)
plot(janusplot_compare(fit, fit_adj,
                       labels = c("marginal", "species-adjusted")),
group = "species")janusplot_direction(): the
residual-independence (HSIC) test that licenses a directional reading of
a pair, or abstains (needs the kernR package).
Real GAM fits via mgcv: EDF, F-test
p-values with optional p_adjust = "BH" or
"holm" across the matrix, confidence bands, derivatives,
random effects via s(g, bs = "re") in
adjust =.
Parallel dispatch via future.apply
for large matrices and sensitivity sweeps.
Deterministic: seed 2026L pins the
shipped demo; user sweeps accept seed =.
A Pearson correlation discards both the shape of an
association and the direction information that a
non-linear data-generating process leaves in its residuals. Under the
additive-noise causal discovery setting (Hoyer et al. 2009; Peters et
al. 2014) the forward regression y ~ s(x) and its inverse
x ~ s(y) are generically asymmetric when the underlying DGP
is non-linear, and that asymmetry identifies the causal direction under
mild conditions. janusplot surfaces this asymmetry as a
visual pre-discovery diagnostic — not a causal
inference procedure. See the vignette and the accompanying paper for
scope and explicit non-claims.
vignette("janusplot") — quickstart + feature tourvignette("shape-recognition-sensitivity") — design,
hypotheses, every diagnostic plotVersion 1.0.0. API_STABILITY.md
lists the exported functions and their lifecycle; NEWS.md lists the changes from 0.2.0.
The testthat suite includes vdiffr
visual-regression snapshots, and the test-coverage workflow above
reports line coverage.
Bug reports and suggestions are welcome through the GitHub issues. See
CONTRIBUTING.md
for how to propose a change.
citation("janusplot")MIT. See LICENSE.md
for the full text.